Starter quiz
- Select the examples of discrete data.
- 50 people were asked how many books they read a week. ✓
- 50 people were asked how many minutes it takes them to get to work/school.
- 50 people were asked what their favourite fruit is. ✓
- 50 pieces of fruit were weighed.
-
- When constructing a histogram with equal bar widths, select which of the following are important points to remember.
- The scale does not need to be consistent.
- Equal bar width with the axis labelled frequency. ✓
- Histograms only display discrete data.
- The and axis must have the same scale.
-
 Here is a table showing the time people spent doing physical activity during a day. How many people spent more than 2 hours doing physical activity?
- '40' ✓
 Here is a histogram showing times taken to complete an IQ test. What percentage of people took more than 10 minutes to complete the IQ test?
- '42%' ✓
 Here is a histogram showing how long people played a game for before they lost their first life. What percentage of people played for 20 seconds or more?
- '60%' ✓
 Here is a histogram showing how long people played a game for before they lost their first life. What percentage of people played for 40 seconds or more?
- '5%' ✓
Exit quiz
- Match the type of density with the definition.
- Frequency density⇔is proportional to the frequency per unit for the data in each class. ✓
- Population density⇔is the number of people living per unit of area. ✓
- Substance density⇔is measured as the substance's mass per unit of volume. ✓
- Which of the following explains why we plot continuous data with unequal bar widths against frequency density?
- It is easier.
- Plotting against frequency makes no difference.
- It illustrates the major features of the distribution of the data. ✓
-
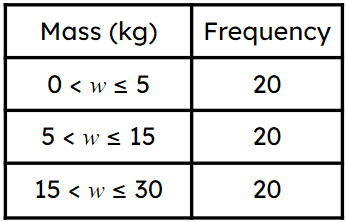
 Match the frequency density with the correct class interval.
- ⇔Frequency density = 4 ✓
- ⇔Frequency density = 2 ✓
- ⇔Frequency density = ✓
 Match the frequency density with the correct class interval.
- ⇔Frequency density = 1.6 ✓
- ⇔Frequency density = 4 ✓
- ⇔Frequency density = 1.4 ✓
- ⇔Frequency density = 3.2 ✓
 Here is a histogram showing the masses of different parcels. Which class interval shows for every 1 kg, there are 2 parcels?
-
- ✓
-
- None
-
- Select which of the following is true given a histogram with unequal bar widths plotted against frequency density.
- The highest bar shows the modal class.
- The bar with the largest area shows the modal class. ✓
- The frequency is the frequency density class width.
- The lowest bar shows the class with the lowest frequency.
-
Worksheet
Loading worksheet ...
Presentation
Loading presentation ...
Video
Lesson Details
Key learning points
- Sometimes data is presented using unequal class widths
- In order to compare, frequency density is used
- Frequency density is proportional to the frequency per unit for the data in each class
- Frequency is proportional to the area of the bar
Common misconception
Histograms with unequal bar widths are plotted against the frequency and/or pupils read the frequency density as the frequency of the class width.
Show what a histogram with unequal bar widths looks like when plotted against frequency. This visual aid will show pupils the distribution of data is difficult to see.
Keywords
Frequency density - Frequency density is proportional to the frequency per unit for the data in each class. Often, the multiplier is 1 meaning that frequency density = frequency ÷ class width.
+