Starter quiz
- Frequency density is proportional to the frequency per unit for the data in each class. Often, the multiplier is 1 meaning...
- Frequency density = frequency class width
- Frequency density = frequency class width ✓
- Frequency density = class width frequency
-
- Select which statements are true.
- Histograms can show discrete and continuous data. ✓
- Histograms show the distribution of data using grouped intervals. ✓
- Histograms with unequal bar widths must be plotted against frequency density. ✓
- Histograms with unequal bar widths must be plotted against frequency.
- Histograms with equal bar widths must not be plotted against frequency density.
-
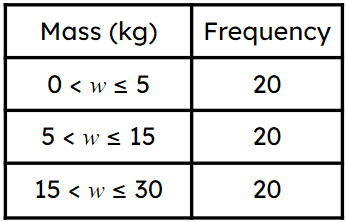 Here is some data on the masses of parcels. Which class interval shows a frequency density of 2?
-
- ✓
-
-
 Here is some data on the lengths of some string. Which class interval shows a frequency density of 1.4?
-
-
- ✓
-
-
 The histogram shows the masses of different parcels. How many parcels have a mass between 5 and 15 kg?
- '20' ✓
- Select which of the following statements are true given a histogram with unequal bar widths plotted against frequency density.
- The highest bar shows the modal class.
- The bar with the largest area shows the modal class. ✓
- The frequency is the frequency density class width.
- The lowest bar shows the class width with the lowest frequency.
- The smallest bar area shows the smallest frequency. ✓
-
Exit quiz
- Which of the following shows the frequency in a histogram with unequal bar widths?
- The area of the bar ✓
- The height of the bar
- The length of the bar
- The frequency density
-
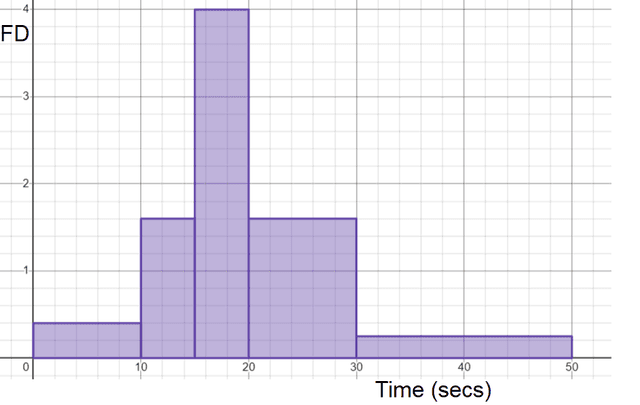 Here are the times taken to type the alphabet. Match the class intervals with the correct frequency density.
- ⇔Frequency density = 0.4 ✓
- ⇔Frequency density = 1.6 ✓
- ⇔Frequency density = 4 ✓
- ⇔Frequency density = 0.25 ✓
 Here is some data on the lengths of some parcels. Match the frequency with the class interval.
- ⇔12 ✓
- ⇔15 ✓
- ⇔20 ✓
- ⇔4 ✓
 Here is a histogram showing lengths of different fruit. Which numbers represent , and on the axis?
- , and
- , and ✓
- , and
- and
-
- Here are the times taken to type the alphabet. Match the class interval to the correct frequency.
- ⇔Frequency = 4 ✓
- ⇔Frequency = 8 ✓
- ⇔Frequency = 20 ✓
- ⇔Frequency = 16 ✓
- ⇔Frequency = 5 ✓
 Here is a histogram showing the time it takes to solve a puzzle.
- ⇔Frequency = 10 ✓
- ⇔Frequency density = 6 ✓
- ⇔Frequency = 15 ✓
- ⇔Frequency density = 2.8 ✓
- ⇔Frequency density = 2.5 ✓
Worksheet
Presentation
Video
Lesson Details
Key learning points
- A frequency table can be used to construct a histogram
- A histogram can be used to construct a frequency table
- Data is sometimes collected using uneven class widths
Common misconception
Histograms with unequal bar widths are plotted against the frequency and/or pupils read the frequency density as the frequency of the class width.
Show what a histogram with unequal bar widths looks like when plotted against frequency. This visual aid will show pupils the distribution of data is difficult to see.
Keywords
Continuous data - Continuous data can take any value within a range. (Height, mass, temperature)
Histogram - A histogram is a diagram consisting of rectangles whose area is proportional to the frequency in each class and whose width is equal to the class interval.
Frequency density - Frequency density is proportional to the frequency per unit for the data in each class. Often, the multiplier is 1 meaning that frequency density = frequency ÷ class width.