Starter quiz
- A __________ is a diagram consisting of rectangles whose area is proportional to the frequency in each class and whose width is equal to the class interval.
- histogram ✓
- box plot
- scatter diagram
- pie chart
- tally table
-
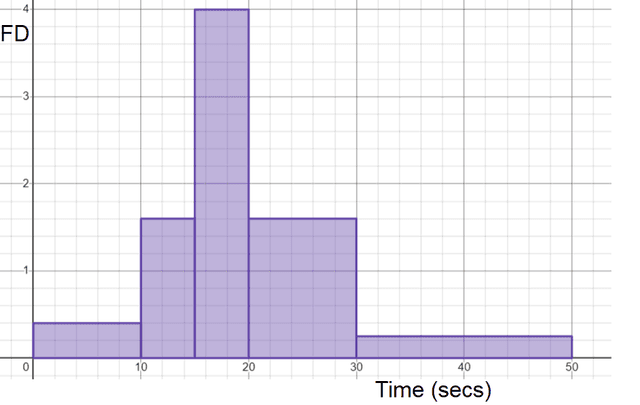
- Here are the times taken to type the alphabet. Which of the following has a frequency density of 1.6?
-
- ✓
-
- ✓
-
-
- Here is some data on the lengths of some parcels. Which of the following have a frequency more than 13?
-
- ✓
- ✓
-
-
- Here is a histogram showing lengths of different fruit. , and are what values?
- , and
- , and ✓
- , and
- , and
-
- Here are the times taken to type the alphabet. Which of the following has a frequency greater than 10?
-
-
- ✓
- ✓
-
-
- Here is a histogram showing the time it takes to solve a puzzle. What is the total frequency?
- '56' ✓
Exit quiz
- The (arithmetic) __________ for a set of numerical data is the sum of the values divided by the number of values. It is a measure of central tendency representing the average of the values.
- mean ✓
- median
- mode
- range
-
- Histograms are excellent visual aids to show the distribution of data, but using the estimate mean from a histogram has more benefits. Select the appropriate reason.
- It provides statistical values for comparison. ✓
- Visual representations of data are too vague.
- Numbers are better than graphs.
-
- Here are some times it takes for Oak class A to type the alphabet. Using the table, work out the estimate mean. There is no need to include the units.
- '16.85' ✓
- Here are some times it takes for Oak class B to type the alphabet. Using the table, work out the estimate mean. There is no need to include the units.
- '13.75' ✓
- The estimate mean for Oak class A was 16.85 seconds and the estimate mean for Oak class B was 13.75 seconds. What does this mean?
- Oak class B are quicker at typing the alphabet than Oak class A. ✓
- Oak class A are quicker at typing the alphabet than Oak class B.
- Both classes have the same estimate mean.
- Oak class B are slower at typing the alphabet than Oak class A.
- Oak class A are slower at typing the alphabet than Oak class B. ✓
-
- Work out the estimate median using this histogram showing lengths of pieces of wood. There is no need to include the units.
- '37.5' ✓
Worksheet
Presentation
Video
Lesson Details
Key learning points
- The mean can be found using a histogram
- The median can be found using a histogram
- An estimate for the frequency within a given data range can be found
Common misconception
Histograms with unequal bar widths are plotted against the frequency and/or pupils read the frequency density as the frequency of the class width.
Show what a histogram with unequal bar widths looks like when plotted against frequency. This visual aid will show pupils the distribution of data is difficult to see.
Keywords
Arithmetic mean - The (arithmetic) mean for a set of numerical data is the sum of the values divided by the number of values. It is a measure of central tendency representing the average of the values.
Frequency density - Frequency density is proportional to the frequency per unit for the data in each class. Often, the multiplier is 1 meaning that frequency density = frequency ÷ class width.
Histogram - A histogram is a diagram consisting of rectangles whose area is proportional to the frequency in each class and whose width is equal to the class interval.