Starter quiz
 Match the feature of the distance-time graph to what it is for.
- horizontal axis⇔shows the time ✓
- vertical axis⇔shows the distance ✓
- scale⇔shows the maximum and minimum values ✓
- gradient (slope)⇔shows the speed of an object ✓
- division⇔numbers on the axis so that values can be read ✓
- grid lines⇔lines from the axes that allow readings to be read easily ✓
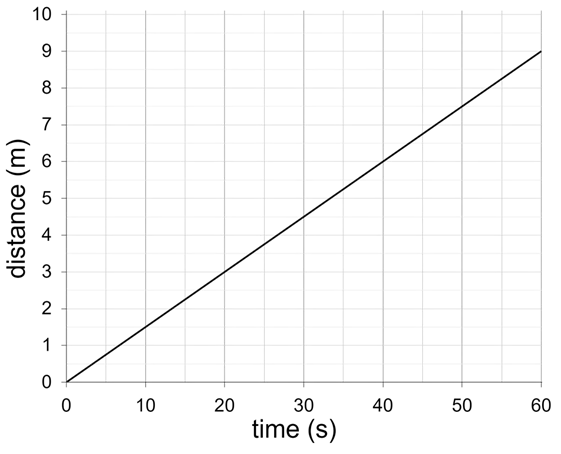
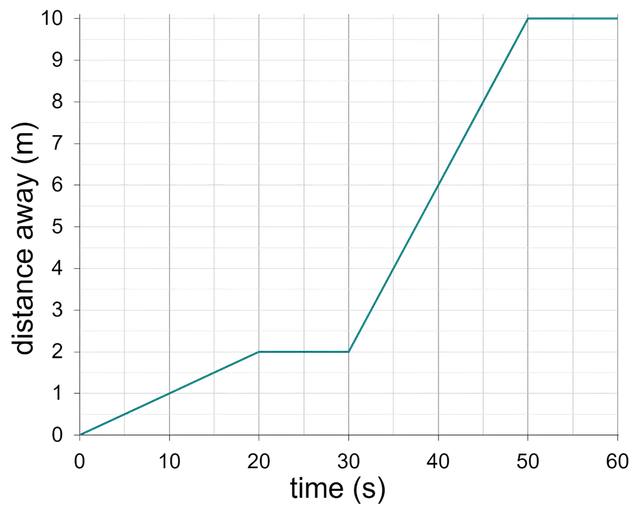
- Use the graph to find out how far this object has travelled in 60 s. Include the unit in your answer.
- '9 m' ✓
- Use the graph to find out how long it takes this object to travel 6 m. Include the unit in your answer.
- '40 s' ✓
- How far does this object travel between 10 s and 40 s?
- 0 m
- 1.5 m
- 4.0 m
- 4.5 m ✓
- 6.0 m
-
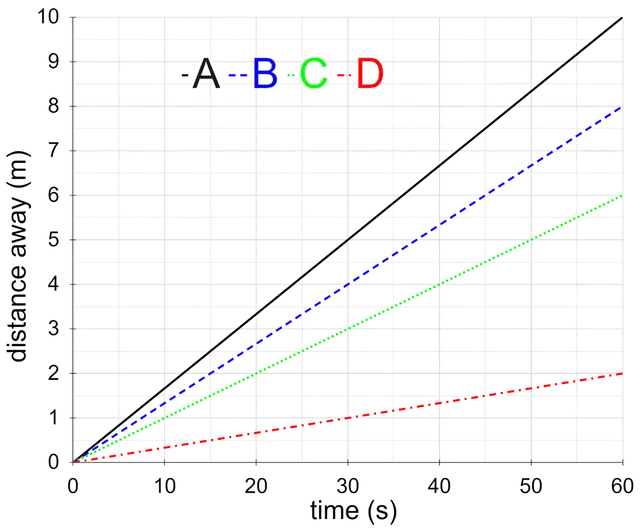 Starting with the fastest, put the objects shown on the graph in order of average speed.
- 1⇔A
- 2⇔B
- 3⇔C
- 4⇔D
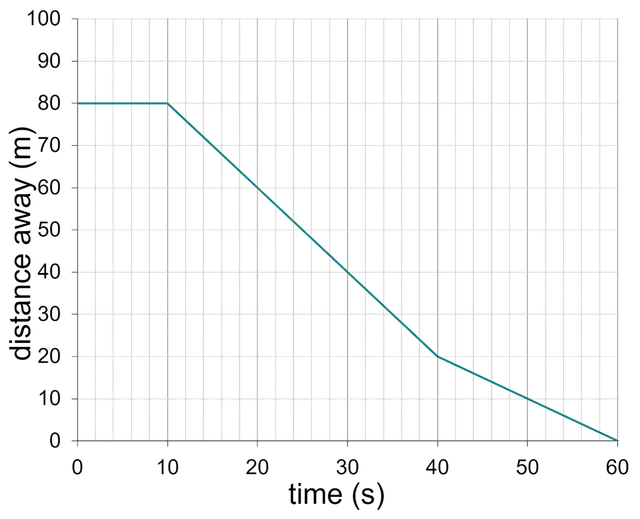
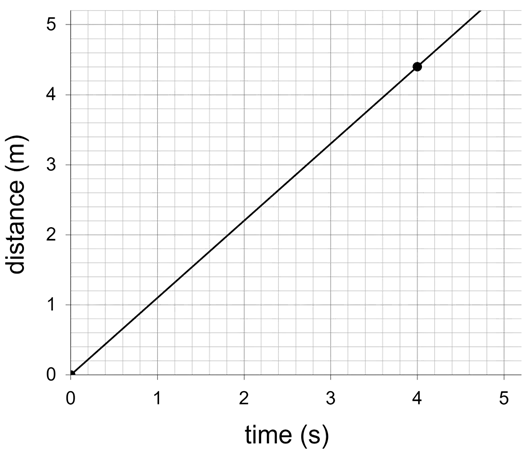 Use the graph to calculate the average speed of the object.
- 1.1 m/s ✓
- 4.0 m/s
- 4.4 m/s
- 1.5 m/s
- 176 m/s
-
+